Access to genomic information

myHERD
Access to genomic information
Access to genomic information
If you're a myDNA customer, you'll automatically receive access to genomic information through myHERD on your DNA profiled females. For non-myDNA customers, access to genomic information is also available, but reliability will be lower due to SNP effects not being included (ie what genes have been inherited from sire & dam) as they have not been DNA tested.
Genotyping animals provides a significant boost to the reliability of breeding values. Reliability is important as it reduces how much an individual animal moves in index/breeding values when herd test information becomes available.
Benefits of genomic information in myHERD:
- Use myHERD to access genomic data for your herd – updated monthly
- Select animals based on different traits and NZMI, relevant to your breeding goals/direction.
- Track genetic gain in your herd over time in the traits that matter to you.
- Select your best females and manage breeding decisions with greater confidence.
What does that mean for farmers who are myDNA testing?
Those using myDNA and herd recording with CRV will have access to more accurate information as data from their own animals flow into myHERD automatically. This will also happen retrospectively, so any animals that have been DNA tested with CRV in the past will have genomics with their added SNP effects (what the heifer/cow has inherited from her sire/dam).
Genomic information increases the reliability of an animal’s breeding values by an average of 25 percent. With better data, you can make more informed decisions by identifying predictors of future performance before calves even enter the herd as milkers.
Females that have been tested through myDNA will have updated parentage and genomic breeding values uploaded to myHERD automatically. That information can be viewed in myHERD via the myDNA report.
Genomic breeding values update automatically each month after the New Zealand Animal Evaluation Run. You can then rank your females on the breeding values that are of interest to you.
Is the data up to date?
myHERD enables farmers to access up to date data. This is updated after each NZ Animal Evaluation run (on a monthly basis) just like the bulls that CRV are currently marketing.
By flowing directly into myHERD it does not require any admin from CRV’s side to keep these figures up to date (vs sending out manual reports once a month).
How can you use the information?
Genomic information in myHERD allows you to select the animals you may want to breed replacements from, and also what calves to rear.
It allows you to fully experience the advantages of using CRV’s young genomic sires, as their genomic influence is transmitted to the resulting heifer calves, accurately reflecting the genetic gain you are achieving by using younger sires.
For herds that are using myDNA, CRV genomics provides greater reliability as it also includes SNP (DNA) effects while also getting parentage verified. The reliability is comparative to a heifer having five herd tests as a 2-year-old. So, farmers can earlier identify what heifers are worth rearing, or worth breeding from before they come into the herd.
What will you see in myHERD?
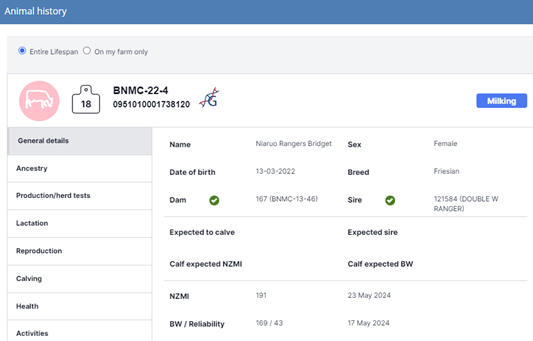
Parentage reporting:
- A tick indicates whether the animal has been matched to its parent.
- This symbol indicates which animals have genomic information.


gBVs
- CRV gBVs will be the default available in the custom reports
- A single gene polled result has also been added to reports
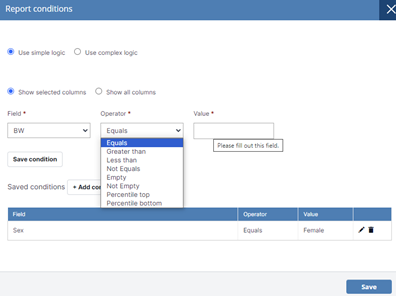
Percentile Groups
- Added to the Custom Reporting is a new condition setting to filter for Percentile Top or Percentile Bottom of the animal group.
- This can be set on any field and the user can select the percentage they wish to use.

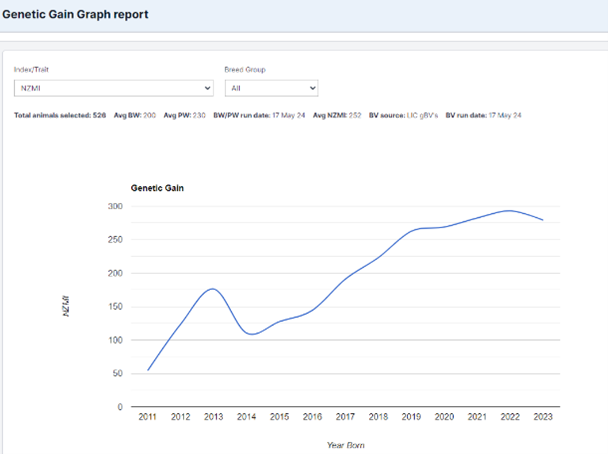
Genetic Gain Graph
This report can be found in the Report Centre under the Animal tab.
Selection can be made from a range of Indexes and Breeding Values, then you can select by Breed if required. The BV data selected will also display under the selection fields.
Under the graph, there is the list of animals included with their resulting index or breeding values. The list is sorted by year groups, oldest year at the top.
If you hover over the line, it will display the result for each year group.


